
Port Congestion Australia – Shipping Trends From China To Australia – Week 41 Update
Written by Leon Chow
China–Australia Freight Forwarding Specialist | Guangzhou Allwin Logistic
China → Australia Shipping Weekly Update
Week 41 | 12 – 18 October 2026
Overall Market Status: 🟡 Post-Holiday Lull, Rates Softening
Port congestion Australia remains the defining challenge for importers in Q4 2026, even as freight rates soften this week.
Golden Week has ended, and most cargo shipped before the holiday, leaving a quiet window with lower rates.
Australian ports remain busy, a new landside congestion issue has emerged at DP World terminals, and carriers continue to change port call rotations.
This weekly update covers the latest port congestion data, carrier schedule changes, rate movements, and practical advice for importers shipping from China to Australia.
Current Port Congestion in Australia
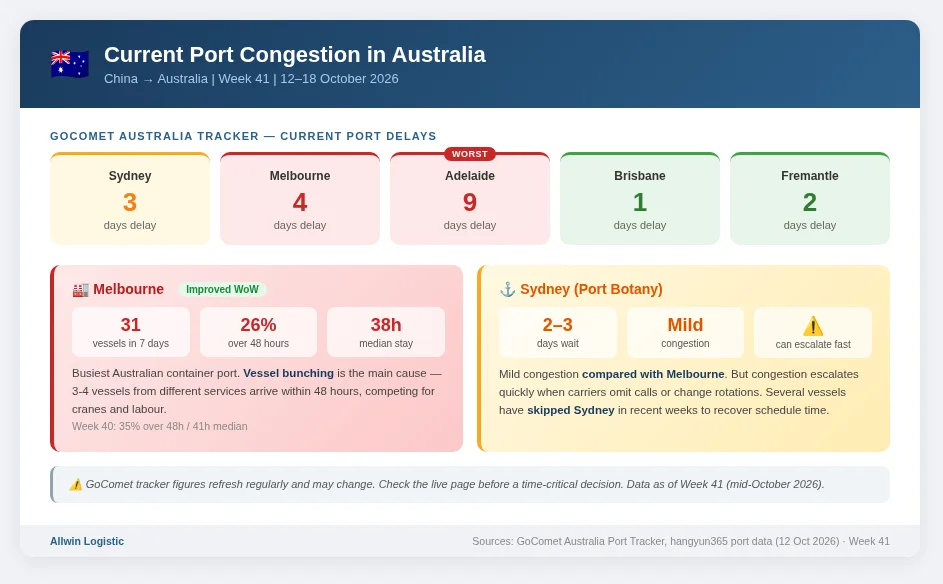
GoComet’s Australia tracker currently reports about 3 days of delay at Sydney, 4 days at Melbourne and 9 days at Adelaide. It also shows about 1 day at Brisbane and 2 days at Fremantle. These figures can change as the tracker refreshes, so check the live page before a time-critical decision.
The figures suggest Australian sea ports are facing uneven pressure rather than one uniform national delay. A port-level index can help identify risk, but it should not be read as the exact waiting time for every ship or a guaranteed cargo-delivery delay.
Port Botany (Sydney) and Melbourne typically operate near capacity from October through December. Port congestion Australia remains an important planning issue for importers, even as cargo volumes ease after China’s National Day holiday. Australian sea ports are facing congestion as the pre-Christmas import surge approaches.
Here is the Week 41 status by port. A port-delay indicator is not the waiting time for every vessel. This update combines public tracking data and carrier notices with Allwin’s booking-market observations. Rate ranges are indicative, not binding offers.
Melbourne Port Congestion
Melbourne is currently the busiest Australian container port. In the past seven days, 31 container vessels arrived. Of those, 8 vessels (26%) stayed in port for more than 48 hours. The median vessel stay was 38 hours (hangyun365 port data, 12 October 2026). This is an improvement from Week 40, when 35% of vessels stayed over 48 hours and the median stay was 41 hours.
Vessel bunching remains the main cause. Three or four vessels from different services arrive within the same 48-hour period, all competing for the same cranes and labour.
Sydney Port Congestion
Sydney (Port Botany) shows mild congestion compared with Melbourne. Current vessel waiting times are approximately 2-3 days. However, Sydney congestion can escalate quickly when carriers omit calls or change rotations. Several vessels have skipped Sydney in recent weeks to recover schedule time.
DP World Landside Congestion — A New Issue
Delay at Australian terminals is no longer only a waterside problem. The Container Transport Alliance Australia (CTAA) has reported truck turnaround times of two to three hours or more at Melbourne’s West Swanson Terminal. A Brisbane congestion alert warns transactions could exceed one hour during peak periods (Big Rigs, 2 October 2026). This landside congestion adds 1-2 days to final delivery after the vessel has berthed.
Brisbane and Other Ports
Brisbane remains relatively stable at 1-2 days for vessel waiting, although the DP World landside alert applies. Fremantle and Adelaide are not currently reporting significant congestion.
Melbourne and Sydney: Berth Delays and Vessel Changes
Recent carrier notices support the view that schedule reliability remains a concern. On 8 October, ANL advised that MAERSK SEMAKAU 639S/642N would call Sydney before Melbourne because of expected berth congestion in Australia. The rotation change aims to reduce vessel downtime on the Australian coast.
On 9 October, ANL also published a rotation change for OOCL TOKYO 147N on the Melbourne–Sydney–Brisbane range due to berth congestion in Sydney. Such changes can affect port-call order, arrival windows and cargo-release timing.
Recent Carrier Notices and Port Omissions
Carrier notices show that schedule recovery can affect both Australian and Chinese ports. ANL reported that ALS JUNO 010S would omit Shanghai following delays associated with berth congestion in Australia. FLORA DELMAS 1726S omitted Ningbo because of congestion in Central China. A port omission may protect the wider schedule, but it can change the route or connection plan for affected cargo.
Importers should track three separate milestones: vessel arrival in the port area, actual berthing, and cargo availability after discharge and terminal processing. They are not interchangeable.
Why Port Congestion Happens: The Vicious Cycle
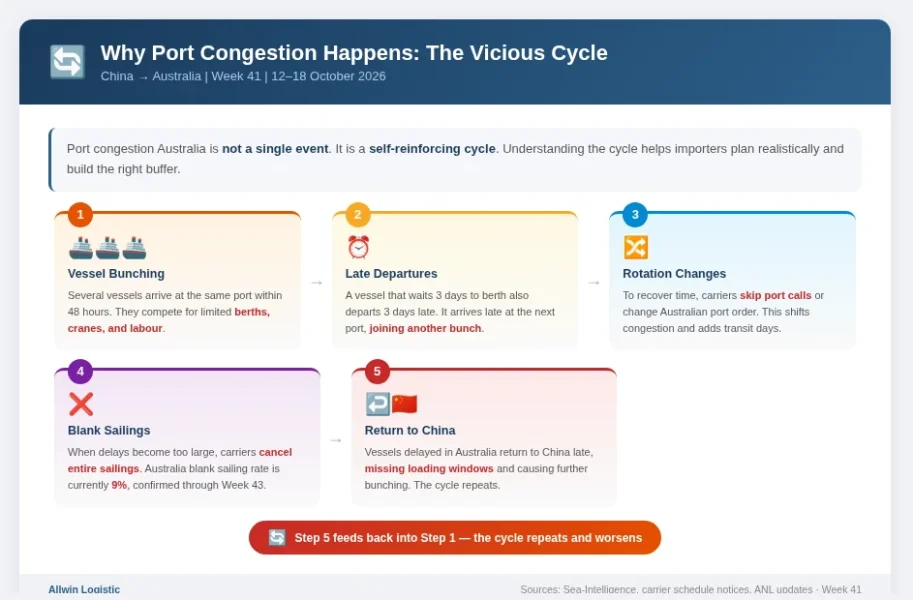
Port congestion Australia is not a single event. It is a self-reinforcing cycle. Understanding the cycle helps importers plan realistically.
Step 1 — Vessel bunching. When several vessels arrive at the same port within 48 hours, they compete for limited berths, cranes, and labour.
Step 2 — Late vessel departures. A vessel that waits three days to berth also departs three days late. It arrives late at the next port, joining another bunch.
Step 3 — Carrier rotation changes. To recover schedule time, carriers skip port calls or change the order of Australian ports. This shifts congestion and adds transit days for cargo.
Step 4 — Blank sailings. When delays become too large, carriers cancel entire sailings. The blank sailing rate on Australia trades is currently 9%, confirmed through Week 43.
Step 5 — Return to China. Vessels delayed in Australia return to China late, missing loading windows and causing further bunching. The cycle repeats.
China Ports and Global Schedule Reliability
The National Day holiday created a concentrated cargo push before and during the holiday period. Based on current market feedback, cargo volume is quieter this week as that rush passes. Lower immediate demand may give importers more room to compare options, but carrier schedules and terminal conditions can still affect transit time.
Shanghai Port
Shanghai’s 7-day average vessel waiting time is approximately 3.51 days (Kuehne+Nagel port operational update, 6 October 2026). Waigaoqiao terminals average 3-4 days. Yangshan terminals exceed 7 days at some berths. Some services are experiencing delays of 10-14 days (CCT Worldwide customer update, October 2026).
Ningbo Port
Ningbo-Zhoushan Port has cleared most of its typhoon backlog. Average container ship berth waiting times fell to approximately one day by 9 October (PortNews, 12 October 2026). However, MSICT yard occupancy is around 96%, and maintenance dredging has blocked one berth (SEKO Logistics APAC port report, October 2026).
South China
Yantian, Shekou, and Nansha remain the most stable Chinese ports. Waiting times are approximately 1-2 days.
Global Schedule Reliability
Global schedule reliability has fallen to 49.9% — the lowest level since 2022. The average vessel delay is 6.81 days. Shanghai schedule reliability fell to 21%, and Ningbo to 34.6% (Sea-Intelligence, reported by Zhejiang Council for the Promotion of International Trade, 8 October 2026). Fewer than one in two vessels arrives on schedule.
Freight Rates Soften Post-Holiday
The National Day holiday created a concentrated cargo push before and during the holiday period. Based on current market feedback, cargo volume is quieter this week as that rush passes. Lower immediate demand may give importers more room to compare options, but carrier schedules and terminal conditions can still affect transit time.
Sea Freight Rates
Sea freight rates have stopped rising and have softened.
Note: ANL announced a rate restoration effective 15 October 2026: an additional USD 500 per 20-foot container and USD 1,000 per 40-foot container for North East Asia to Australia (ANL official notice, 2 October 2026). However, actual spot rates have softened due to low post-holiday volume. Shippers should confirm all-in rates before booking, as the gap between announced increases and actual market rates can vary by carrier and booking date.
Air Freight Rates
Air freight rates have also dropped significantly from the pre-holiday peak. With post-holiday cargo volumes lower, some shippers may find more flexible options. Availability remains route- and airline-specific. Confirm the booking and cut-off before sending cargo to the warehouse. For urgent stock, compare total door-to-door lead time rather than flight time alone.
Outlook for Rates
The rate softening is likely temporary. Q4 pre-Christmas demand is expected to pick up from late October as retailers restock for the holiday season. Air freight rates on the Asia-Australia lane typically increase 20-50% above off-peak levels during October and November (Swift Cargo Solutions, October 2026). Shippers with Q4 cargo may find this post-holiday window a good opportunity to lock in lower rates before demand returns.
What This Means for Your Cargo: Actual Transit Times
Reports and schedules can be confusing. The simple question is: how many days does my cargo actually take now?
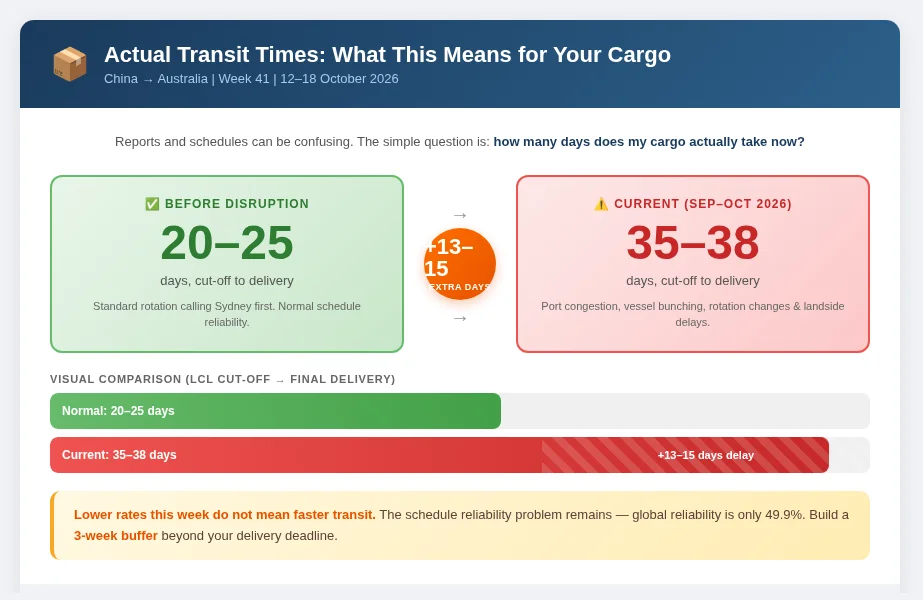
Based on Allwin Logistic operational data from the past three weeks (September to early October 2026), the total time from LCL cut-off date to final delivery in Australia is now 35-38 days. This is the average of completed shipments tracked from cut-off to delivery (Allwin Logistic operational shipment data, Guangzhou, September-October 2026).
Before the current disruption, when vessels followed the standard rotation calling Sydney first, the same journey took 20-25 days.
This means your cargo now takes approximately 13-15 extra days compared with normal conditions. This is the practical impact of port congestion, vessel bunching, carrier rotation changes, and landside delays at Australian terminals. Lower rates this week do not mean faster transit — the schedule reliability problem remains.
Case Study: One Shipment, 12-17 Days Extra Delay
To show how these disruptions play out in practice, here is a real shipment handled by Allwin Logistic in Week 41.
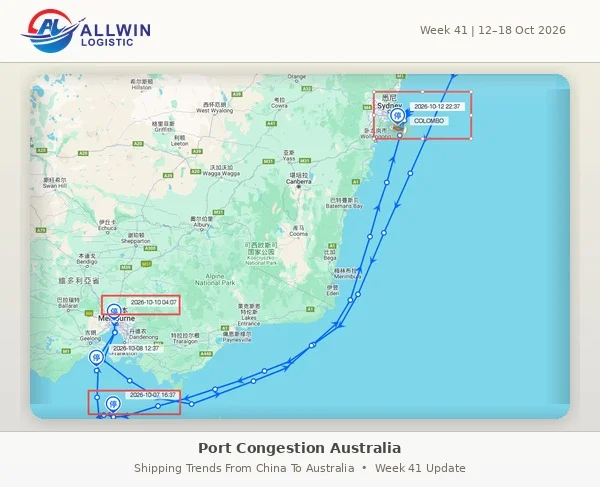
The cargo was booked from Shekou to Sydney on COSCO’s COLOMBO V.085S (A3X route). The normal rotation for this service is Qingdao → Shanghai → Shekou → Melbourne → Sydney → Qingdao.
To recover schedule time after Shanghai congestion, the vessel skipped Qingdao entirely and sailed directly from Sydney back to Shanghai. After waiting a few days, it departed Shanghai on time on 17 September, arrived Shekou on time, and departed Shekou on 21 September.
The normal sailing time from Shekou to Melbourne is 14 days, with an expected arrival on 5 October. However, due to congestion at both Sydney and Melbourne, the vessel slowed its speed. The vessel’s slower progress may reflect congestion and waiting time around both Melbourne and Sydney, although the precise cause and any speed adjustments have not been confirmed by the carrier. It arrived near Melbourne on 7 October but waited until 10 October to berth — three days at anchor.
As of 12 October, the vessel has reached Sydney’s outer anchorage and is waiting to berth. The exact berthing date is not yet confirmed.
This cargo was originally planned for COSCO’s A3S express service, which calls Sydney first. Under normal conditions, it would have arrived around 3 October and been delivered to the customer by 9 October. However, the A3S sailing was blanked due to carrier schedule adjustments, forcing the cargo onto COLOMBO V.085S instead.
The result: delivery is now expected between 21 and 26 October — a delay of 12 to 17 days beyond the original plan.
This is not an isolated case. It reflects the current reality: even when carriers actively manage congestion in China, Australian port congestion continues to cause significant delays downstream. (Source: Allwin Logistic operational tracking, COSCO COLOMBO V.085S, September-October 2026.)
How Importers Can Plan Around Congestion
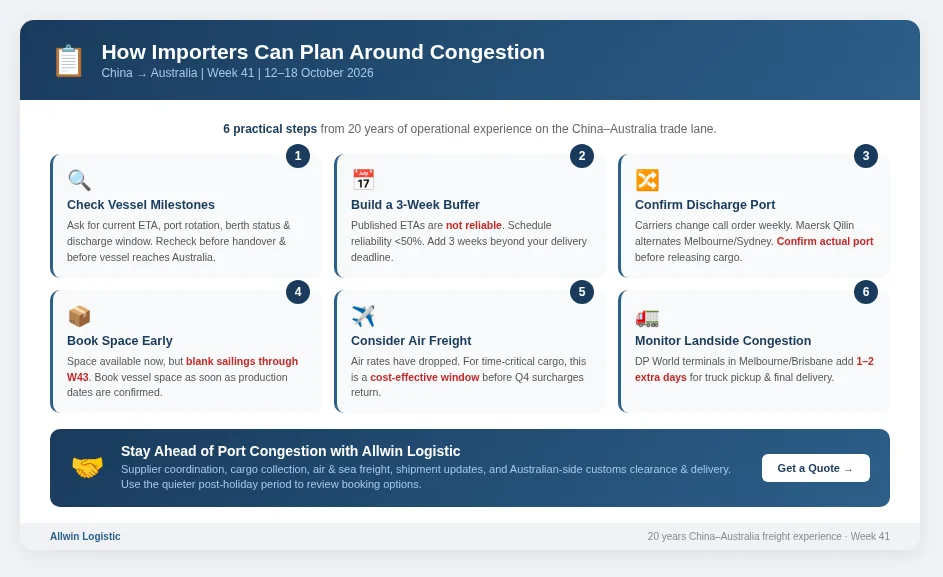
Stay ahead of port congestion in Australia with these practical steps. These recommendations come from 20 years of operational experience on the China-Australia trade lane.
1. Check the latest vessel milestones
Ask for the current ETA, port rotation, arrival status, berth status and expected discharge window. Recheck the plan before cargo handover and before the vessel reaches Australia.
2. Build a 3-Week Buffer
Published ETAs are not reliable. Schedule reliability is below 50%. Build a three-week buffer beyond your delivery deadline. If your stock must be on shelves by 1 December, plan for a cut-off date no later than early October.
3. Confirm the Actual Australian Discharge Port
Carriers are changing port call order weekly. Maersk Qilin service alternates Melbourne and Sydney across 10 consecutive sailings. MAERSK SEMAKAU 639S/642N changed rotation to call Sydney before Melbourne (ANL, 9 October 2026). Confirm the actual discharge port before releasing cargo.
4. Book Space Before Cargo Is Ready
Space is more available this week, but blank sailings continue through Week 43. Do not assume space will remain available. Book vessel space as soon as production dates are confirmed.
5. Consider Air Freight — It Is Cheaper Now
Air freight rates have dropped. For time-critical cargo, this is a cost-effective window before Q4 peak surcharges return. Air freight costs more per kg than sea, but it prevents stockouts and protects delivery commitments.
6. Monitor Landside Congestion
DP World terminal congestion in Melbourne and Brisbane adds delay after the vessel has berthed. Factor 1-2 extra days for truck pickup and final delivery when planning through these terminals.
Stay Ahead of Port Congestion in Australia with Allwin Logistic
Allwin Logistic supports shipments from China to Australia with supplier coordination, cargo collection, air and sea freight arrangements, shipment updates, and coordination with Australian-side partners for customs clearance and local delivery. For customers managing multiple Chinese suppliers, early coordination can help align cargo-ready dates, booking cut-offs and delivery priorities.
Our Week 41 recommendation is to use the quieter post-holiday period to review booking options while continuing to monitor berth status and schedule changes. For a time-sensitive shipment, share the origin, destination, cargo-ready date, dimensions, weight and required delivery date so we can compare suitable options.
Contact Allwin Logistic for a China–Australia shipping review or updated freight quote. Final rates and transit times depend on shipment details and space confirmation.
Frequently Asked Questions
What is causing port congestion in Australia right now?
Port congestion Australia is driven by vessel bunching, the approaching pre-Christmas import surge, carrier rotation changes, and blank sailings. Melbourne is the most congested port, with 26% of vessels staying over 48 hours. A new landside congestion issue at DP World terminals adds further delay.
Have freight rates from China to Australia gone down?
Yes. Sea freight rates have softened to approximately USD 2,300-2,600 for 20-foot containers and USD 4,600-5,200 for 40-foot containers. Air freight rates have dropped to USD 2.80-4.10 per kg. This follows the Golden Week shipping rush, when most cargo moved before the holiday. However, rates are expected to rise again as Q4 demand picks up from late October.
How long are actual transit times from China to Australia?
Based on Allwin Logistic operational data, current total transit time from LCL cut-off to final delivery is 35-38 days. Before the current disruption, the same journey took 20-25 days. This is an increase of 13-15 days. Lower rates do not mean faster transit — schedule reliability remains below 50%.
Will port congestion improve soon?
Congestion is likely to persist through the Q4 peak season (October-December). Blank sailings are confirmed through Week 43, and schedule reliability remains below 50%. This week sees a temporary lull due to post-Golden Week lower volume, but cargo is expected to build from late October.
Does a port-delay figure mean every vessel waits that long?
No. It is a port-level indicator based on the provider’s methodology. Individual vessels can wait for shorter or longer periods. Check vessel-specific arrival and berthing information.
Why should I choose Allwin Logistic for China-to-Australia shipping?
Allwin Logistic has 20 years of experience on the China-Australia trade lane. We operate on-ground in Australia through Hai Son Shipping and Transport Pty Ltd, providing local warehousing, delivery, and customs clearance. We monitor port congestion, carrier rotations, and rate changes daily, and we pass that information to our clients every week. Our goal is to be your logistics partner in China — bridging communication with suppliers, confirming shipping arrangements, and saving you time and effort.
About the Author
Leon Chow is the General Manager of Guangzhou Allwin Logistic Co., Ltd., a freight forwarding company with 20 years of specialisation in China-to-Australia and China-to-New Zealand shipping. Allwin Logistic operates an Australian subsidiary, Hai Son Shipping and Transport Pty Ltd (haison.com.au), providing local warehousing, delivery, and customs clearance services. Leon and his team publish the weekly “Shipping Trends From China To Australia” update to help importers stay informed about port congestion, rate changes, and schedule disruptions.
Sources, Methodology and FAQs
Research checked on 12 October 2026. Public sources include GoComet’s live Australia port-delay tracker, ANL carrier notices and DAFF biosecurity notices. Allwin’s ocean and air rate ranges are current booking-market indications supplied by Allwin. The COSCO Colombo V.085S example is based on Allwin’s shipment tracking and operational observations; the explanation linking vessel progress to congestion is presented as a likely factor, not a carrier-confirmed cause. Live indicators and ETAs may change after publication.