
Port Congestion in Australia – Shipping Trends From China To Australia – Week 40 Update
Written by Leon Chow
China–Australia Freight Forwarding Specialist | Guangzhou Allwin Logistic
China → Australia Shipping Update
Week 40 | 05 October – 11 October 2026
Overall Market Status: 🟠 Elevated Disruption
Golden Week has ended. Factories reopen on 8 October. Held cargo is now releasing into a port system still recovering from typhoon disruptions. Also, Australian ports are busier than usual, with Melbourne reporting average vessel waits of 5.4 days.
Port congestion in Australia is rising as China’s Golden Week ends and held cargo releases into the supply chain. This Week 40 update covers current conditions at Sydney and Melbourne, carrier rotation changes, rate movements, and what importers should do before the pre-Christmas peak season.
We handle hundreds of shipments from China to Australia every month. Our team operates from Guangzhou and maintains a local warehouse and delivery in Australia through our team. This update draws on our live booking data, carrier announcements, and industry port monitoring.
Current Port Congestion in Australia
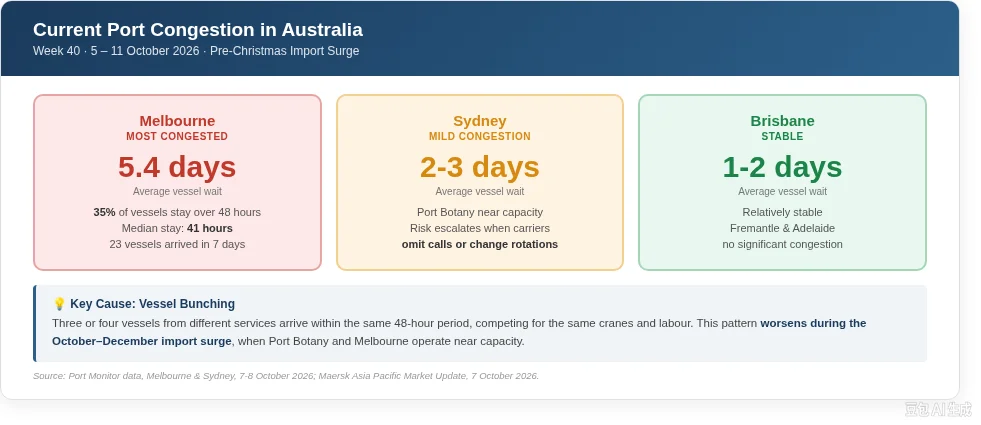
Australian ports are entering their busiest period of the year. Also, the pre-Christmas import surge runs from October to December, when Port Botany (Sydney) and Melbourne operate near capacity.
Melbourne Port Congestion
Melbourne is currently the most congested Australian container port. Average vessel waiting time reached 5.4 days in early October. Of the 23 vessels arriving in the past seven days, 8 vessels (35%) stayed in port for more than 48 hours. The median vessel stay was 41 hours.
Source: Port Monitor data, Melbourne (AUMEL), 7 October 2026; ShipNext port congestion index.
Vessel bunching is the main cause. Three or four vessels from different services arrive within the same 48-hour period, all competing for the same cranes and labour. Meanwhile, this pattern worsens during the October-December import surge.
Source: Swift Cargo Solutions, “Australian Port Delays Have Seven Distinct Causes,” July 2026.
Sydney Port Congestion
Sydney (Port Botany) shows mild congestion compared with Melbourne. Twenty-three container vessels arrived in the past seven days. Current vessel waiting times are approximately 2-3 days.
Source: Port Monitor data, Sydney (AUSYD), 8 October 2026; Maersk Asia Pacific Market Update, 7 October 2026.
However, Sydney congestion can escalate quickly when carriers omit calls or change rotations. Several vessels have skipped Sydney in recent weeks to recover schedule time.
Brisbane and Other Ports
Brisbane remains relatively stable at 1-2 days. Fremantle and Adelaide are not currently reporting significant congestion.
Source: Maersk Asia Pacific Market Update, 7 October 2026.
Carriers Are Changing Port Calls and Rotations
Port congestion in Australia is forcing carriers to adjust their rotations. These changes mean published proforma schedules should not be treated as fixed delivery dates.
- MAERSK SEMAKAU 639S/642N (AAXS service): Changed rotation to call Sydney before Melbourne due to expected berth congestion in Australia.
- OOCL Shanghai 101N (A3N service): Changed rotation to call Brisbane before Melbourne due to berth congestion in Melbourne.
- COSCO Singapore 203S/N: Omitted Sydney.
- Maersk Qilin service: Temporary adjustment covering 10 sailings (641S-650S). Melbourne and Sydney alternate on consecutive sailings instead of calling both ports on every voyage.
Source:
Maersk official advisory, “Qilin Service Temporary Adjustment,” 21 September 2026.
ANL official customer notice, 8 October 2026, anl.com.au.
ANL official customer notice, September 2026, anl.com.au.
For importers, the key lesson is simple: confirm the actual port rotation before releasing cargo. A vessel scheduled for Melbourne may now call Sydney first, or vice versa.
China Port Situation After Golden Week
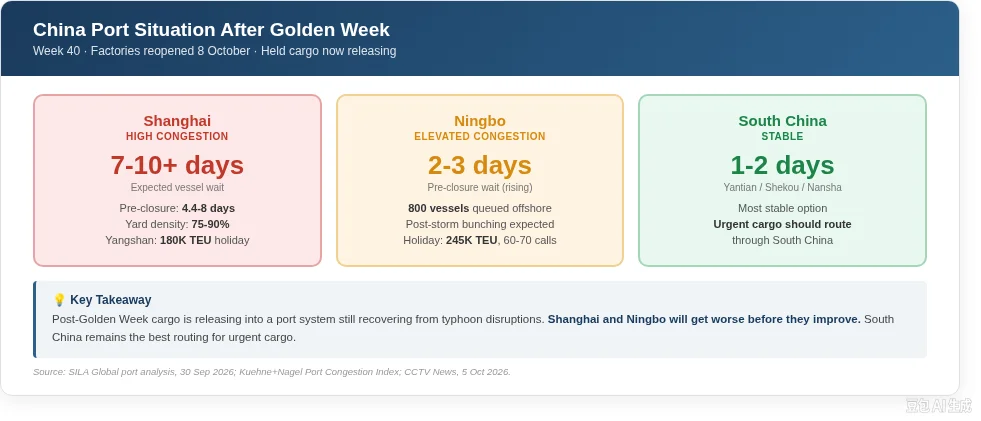
Chinese factories reopened on 8 October after the seven-day Golden Week closure (1-7 October). Held cargo is now releasing, and port congestion is expected to worsen before it improves.
Shanghai
Shanghai’s major terminals saw pre-closure berth waiting times of 4.4-8 days. Post-reopening vessel bunching is expected to push waits to 7-10 days or more. Yard density remains between 75% and 90%.
Source: SILA Global port analysis, 30 September 2026; Kuehne+Nagel Port Congestion Index.
During the holiday, Shanghai’s Yangshan automated terminal handled 79,000 TEU in the first three days, up 18.7% year on year. Total holiday throughput was expected to exceed 180,000 TEU.
Source: CCTV News, “National Day Port Observation,” 5 October 2026.
Ningbo
Ningbo’s pre-closure waits averaged 2-3 days, but approximately 800 vessels were queued offshore. Post-storm berth congestion will be significant as these vessels arrive simultaneously.
Source: SILA Global port analysis, 30 September 2026.
Ningbo Zhoushan Port expected 60-70 vessel calls during the holiday, with total throughput of 245,000 TEU. Average daily operations exceeded 35,000 TEU.
Source: CCTV News, 5 October 2026.
South China
Yantian, Shekou, and Nansha remain the most stable Chinese ports. Waiting times are approximately 1-2 days. Urgent cargo should route through South China where possible.
Freight Rates Continue to Rise
Ocean freight rates from China to Australia have increased for four consecutive rounds since September.
The ANL rate restoration effective 1 October 2026 added USD 500 per 20-foot container and USD 1,000 per 40-foot container for North East Asia to Australia shipments.
Source: ANL official notice, “North East Asia to Australia Rate Restoration,” anl.com.au.
ANL has now announced a further rate restoration effective 15 October 2026: another USD 500 per 20-foot container and USD 1,000 per 40-foot container. This is the fourth increase since September.
Source: ANL official notice, “North East Asia to Australia Rate Restoration,” 2 October 2026, anl.com.au.
Schedule Reliability and Blank Sailings
Global schedule reliability remains at 56.4%, the weakest level of 2026. Average vessel delay is 6.06 days.
Source: Sea-Intelligence Global Liner Performance Report, September-October 2026.
The blank sailing rate on Australia trades holds at 9%. Carriers have confirmed blank sailings through Week 43. This capacity withdrawal, combined with post-holiday cargo release, will keep space tight through mid-October.
Source: Linerlytica Market Pulse, October 2026.
What This Means for Your Cargo: Actual Transit Times
Reports and schedules can be confusing. The simple question is: how many days does my cargo actually take now?
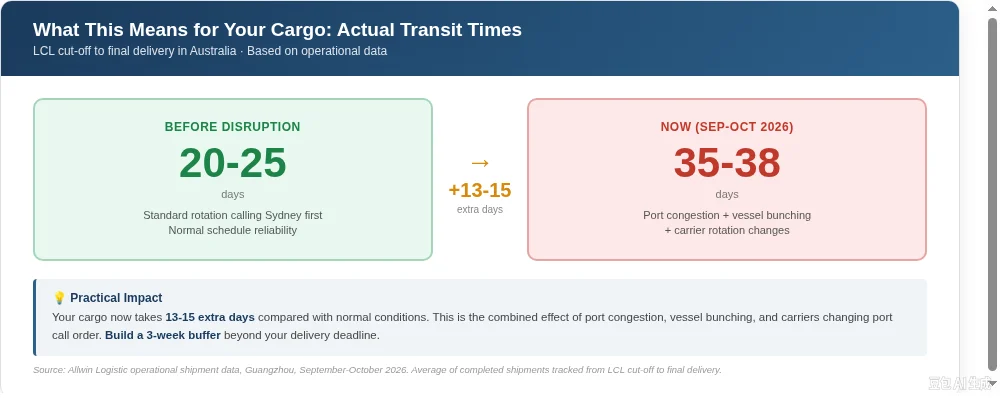
Based on our operational data from the past three weeks (September to early October 2026), the total time from LCL cut-off date to final delivery in Australia is now 35-38 days.
Source: Allwin Logistic operational shipment data, Guangzhou, September-October 2026. Average of completed shipments tracked from cut-off to delivery.
Before the current disruption, when vessels followed the standard rotation calling Sydney first, the same journey took 20-25 days.
This means your cargo now takes approximately 13-15 extra days compared with normal conditions. This is the practical impact of port congestion, vessel bunching, and carrier rotation changes.
Why Port Congestion Happens: The Vicious Cycle
What causes the congestion
Three factors combine to create the current port congestion in Australia:
- Vessel bunching. Three or four vessels from different services arrive within the same 48-hour period, all competing for the same cranes and labour. This is worst during the October-December import surge.
Source: Swift Cargo Solutions, “Australian Port Delays Have Seven Distinct Causes,” 2026.
- Post-Golden Week cargo release. Chinese factories closed for seven days (1-7 October). Held cargo is now releasing in a compressed window, overwhelming normal port handling capacity.
- Low schedule reliability. Global schedule reliability is 56.4%. When vessels arrive late, they bunch up at the next port, creating a domino effect.
Source: Sea-Intelligence Global Liner Performance Report, October 2026.
How carrier rotation changes add days to your cargo
When a port is congested, carriers change the order of port calls to reduce waiting time. This sounds efficient, but it adds days to cargo destined for the port that is now called later.
Example: COSCO A3S fast service from Shenzhen to Australia.
Normal rotation: Shenzhen → Sydney (11 days) → Melbourne (3 days) → Brisbane (5 days) → back to Shenzhen (~10 days).
Changed rotation (Melbourne first): Shenzhen → Melbourne (14 days) → Sydney (3 days). Cargo for Sydney now takes 17 days port-to-port instead of 11 days — an extra 6 days.
This calculation does not include additional berth waiting time at either port. With congestion, the actual delay can be 8-10 days or more.
Source: Allwin Logistic carrier schedule analysis, COSCO A3S service, October 2026. Based on published proforma schedules and actual rotation change notices.
The vicious cycle: why delays get worse
Congestion creates a feedback loop that is hard to break:
- Vessels wait at anchor in Australia due to port congestion.
- Late arrivals in Australia mean late departures back to China.
- Late return to China means the next sailing is delayed or cancelled (blank sailing).
- Blank sailings reduce available capacity, pushing more cargo onto fewer vessels.
- Fewer vessels means more bunching at Australian ports — and the cycle repeats.
This is why schedule reliability has fallen to 56.4% and why blank sailings have been confirmed through Week 43. The disruption is self-reinforcing until demand eases or carriers add capacity.
What Importers Should Do Now
- Book space now for late October and November. Post-holiday backlog plus pre-Christmas peak season will tighten available capacity.
- Lock rates before 15 October. The next ANL GRI adds another USD 500 per 20-foot container.
- Build a 3-week buffer beyond your delivery deadline. Current transit time is 35-38 days versus 20-25 days normal. Do not plan around published ETA.
- Confirm the actual Australian discharge port before releasing cargo. Carriers are changing rotation order between Sydney and Melbourne.
- Route urgent cargo through South China ports. Yantian and Shekou have 1-2 day waits versus 7-10 days in Shanghai.
- Consider air freight for time-sensitive cargo. A brief special rate window (5-11 October) may offer USD 0.20-0.40/kg below normal rates on some routes.
Outlook: Pre-Christmas Peak Season
October marks the start of Australia’s pre-Christmas import surge. Port Botany and Melbourne typically operate at near capacity from October through December. A vessel that would berth immediately in March can wait 2-4 days at anchor in November.
Source: Swift Cargo Solutions port analysis, 2026.
By late October, capacity should gradually stabilise as the post-Golden Week backlog clears. However, Q4 peak season demand will keep rates above summer levels and transit times extended through December.
Port congestion in Australia is not a short-term issue. It is a structural condition of the peak season. Importers who plan early, confirm rotations, and build a 3-week buffer will avoid the worst disruptions.
Frequently Asked Questions
How long does cargo actually take from China to Australia now?
Based on our operational data from the past three weeks, total time from LCL cut-off to final delivery is 35-38 days. Before the current disruption, the same journey took 20-25 days. This means cargo now takes 13-15 extra days.
Source: Allwin Logistic operational shipment data, September-October 2026.
How much buffer time should I build into my plan?
We recommend building a minimum of 3 weeks (21 days) of buffer beyond your delivery deadline. This accounts for port congestion, carrier rotation changes, and schedule unreliability. Do not plan around published ETA dates.
How long are vessels waiting at Melbourne and Sydney?
Melbourne average wait is 5.4 days, with 35% of vessels staying over 48 hours. Sydney wait is approximately 2-3 days. These figures change weekly as carrier rotations adjust.
Source: Port Monitor, 7-8 October 2026.
Why are carriers changing port call order?
Carriers change rotation to reduce downtime on the Australian coast. If Melbourne is congested, a vessel may call Sydney first to avoid waiting at anchor. However, this reduces overall voyage time but changes the discharge port order for cargo.
Will port congestion in Australia get worse before Christmas?
Yes. The pre-Christmas import surge runs October-December. As a result, port Botany and Melbourne operate near capacity during this period. Expect 2-4 additional days of berth waiting compared with the annual average.
Source: Swift Cargo Solutions, 2026.
Sources & References
- Port Monitor data, Melbourne (AUMEL) and Sydney (AUSYD), 7-8 October 2026
- Maersk Asia Pacific Market Update, 7 October 2026, maersk.com
- ANL official customer notices, rotation changes and rate restorations, anl.com.au, September-October 2026
- Maersk Qilin Service Temporary Adjustment advisory, 21 September 2026
- Sea-Intelligence Global Liner Performance Report, September-October 2026
- Linerlytica Market Pulse, October 2026
- Kuehne+Nagel Port Congestion Index, October 2026
- SILA Global port congestion analysis, 30 September 2026
- Swift Cargo Solutions, “Australian Port Delays Have Seven Distinct Causes,” 2026
- CCTV News, “National Day Port Observation,” 5 October 2026
- Allwin Logistic operational booking data, Guangzhou, Week 40, October 2026